Alerts
WaveMaker uses the Prometheus AlertManager to listen to the data accumulated at Prometheus and fire an alert based on the query included in the alert.
Accessing Alerts
The list of Alerts can be accessed from Prometheus UI by clicking on the "Alerts" button as shown in the below image
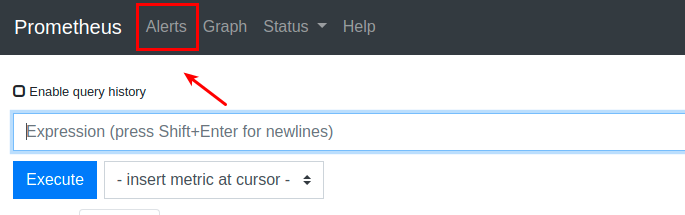
Available Alerts
Following are the list of alerts included in WaveMaker
Platform Health
| Alert Name | Description |
|---|---|
| InstanceDown | Instance is down. |
| RootDiskSpaceFull | Root Disk space on an instance is full |
| PlatformDataDiskSpaceFull | Platform Disk space on an instance is full |
| ExternalInstanceDataDiskSpaceFull | External Instance (Backup Server) Disk space is full |
| RuntimeDiskSpaceFull | Volume mounted to a container is full |
| MemoryFull | Less Instance Memory is available |
| HighCPU | The CPU is used extensively |
| ContainerDown | The container is not sending health signals |
| UserContainerMemoryUsage | The User workspace container has Less Memory |
| AppContainerMemoryUsage | The User Application container has Less Memory |
| TomcatDeploymentFailed | A Platform microservice has a deployment failure |
| JvmThreadsDeadlocked | When a JVM thread encounters a deadlock |
| PlatformInstanceDown | An Instance in the Platform is not sending health signals |
Slow APIs
| Alert Name | Description |
|---|---|
| LongRunningUserAPICallDetected | An API call submitted by the user is taking a long time to process |
| LongRunningPlatformAPICallDetected | An intercommunication API call is taking a long time to process |
| PlatformBottleNeckDetected | A microservice has a lot of pending API calls. This will slow down the whole platform |
API Failures
| Alert Name | Description |
|---|---|
| TooManyExceptions | A huge number of exceptions are detected in a short period |
| TooManyUnseenExceptions | A huge number of new exceptions are detected in a short period |
Container Orchestration
| Alert Name | Description |
|---|---|
| ContainerActivationFailed | The Container Activation failed |
| ContainerPassivationFailed | The Container Passivation Failed |
| ContainerHibernationFailed | The Container Hibernation Failed |
| ContainerAllocationsFull | There is not enough space in the platform for a new user Container Allocation |
VCS operations
| Alert Name | Description |
|---|---|
| VcsPullFailed | A VCS pull operation Failed |
| VcsPushFailed | A VCS push operation Failed |
Background Jobs
| Alert Name | Description |
|---|---|
| TaskIdleTimeout | The task of a job submitted to jobs-service has not been served by the worker. More workers are probably needed |
| TaskExecutionTimeout | The worker was unable to complete the task of a job submitted to jobs-service |
Project failures
| Alert Name | Description |
|---|---|
| ProjectCreationFailed | A User could not create a project in Studio |
| ProjectImportFailed | A User could not import a project in Studio |
| ProjectOpeningFailed | A User project opening Failed |
| ProjectMigrationFailed | A User could not migrate his project successfully |
note
The Alerts listed above keep changing as new things are discovered and might vary over time
Configure Notifications for Alerts
Prometheus uses an alert manager to send notifications. In WaveMaker Enterprise Setup alert notifications are configured through the Email channel by default. The below link explains the configuration of alert notifications using various other channels like Slack ,Pageduty etc.https://prometheus.io/docs/alerting/latest/configuration/
Configure Alert Notifications using Email Channel
- SSH to Platform Instance and edit the file /wm-runtime/conf/alertmanager/config/config.yml by replacing the below place holders
- @SMTP_HOST@ and @SMTP_PORT@ with your Corporate SMTP Server Details.
- @SMPT_FROM_EMAIL@ and @SMTP_EMAIL@ with Corportate EmailAddress ex: notifications@xyz.com
- @SMTP_PASSWORD@ with valid password.
- Change the Receivers EmailAddress replace 'devops-alerts@wavemaker.com' with your Corporate EmailAddress ex:devops@xyz.com
- Restart AlertManager Container using the below commands.
- docker exec -it alertmanager supervisorctl stop alertmanager
- docker exec -it alertmanager supervisorctl start alertmanager